Reading Time: 6 minutes
Have you tried Burbn? No, we’re not offering you a cocktail. We’re referring to the first prototype of Instagram. It was a web app called Burbn, and the name was inspired by the founder’s love of whiskeys and bourbons.
Burbn evolved into one of the hottest apps, and when Instagram was launched on October 6, 2010, it racked up 25,000 users in one day. Instagram went on to be scooped up by Facebook (now Meta) in 2012 to the tune of $1 billion.
But the road to success wasn’t always easy for Burbn and Instagram. After the initial adoption, the app struggled to get off the ground and find its product market fit. So, the company focused on the product’s analytics to understand what made users gravitate to the app and, more specifically, what features were driving value. For Burbn, that was sharing photos. The rebrand and removal of less used features is what led to the success of Instagram. The old ‘less is more’ philosophy was in full effect, making the features its users cared about better with the infamous filters!
The lesson learned is not to get caught up in the software product’s technology but rather understand what is truly driving business value or product market fit and run towards that. This approach can help build better solutions that lead to better outcomes – such as a Facebook acquisition!
But how does a company make this strategy shift and refocus its efforts on product analytics? It starts with having the right tools as part of your software product development lifecycle and then leveraging your analytics tools to optimize business value.
What are product analytics?
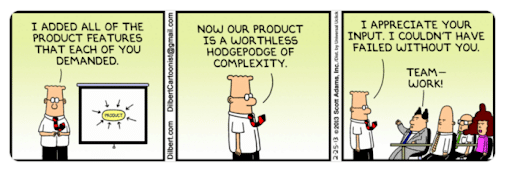
Alright, first off… Who’s been here?
Top software companies — such as Facebook, Spotify, Doordash, Robinhood, etc. — approach the launch of new software products by following a product development lifecycle. This lifecycle typically encompasses the following stages and is powered by the corresponding Salesforce system:
- Ideation: Organizations brainstorm around a hypothesis, a North Star metric, the product market fit, and consider regulatory needs depending on the industry.
- Design (Product Design): Teams work on persona creation, UI/UX, and user journeys. The metrics are solidified, and the business goals are identified. This stage uses Jira, Figma, and Miro.
- Build: During this phase, companies develop software, test it, and outline a deployment strategy and development pipeline. This process may involve using nCino and Salesforce Financial Services Cloud for the banking and lending industry.
- Market (Product Marketing): Marketing campaigns and journeys are conducted with Salesforce Marketing Cloud. The goal is to promote the specific benefit for the end users.
- Measure/Learn (Product Analytics): Standard Salesforce reporting, CRM Analytics, and Tableau are usually used for industry benchmarking, reporting, and strategy review.
We’re going to focus on that final one here because product analytics fall into the Measure/Learn stage.
With so much potential for the vast amount of available analytics, companies need to pinpoint which ones are the most important and relevant for business success. Those critical insights extracted from the analytics are then entered back into the lifecycle as a hypothesis, and the product development circle begins all over again.
5 questions to ask for a thriving product analytics strategy
The following questions provide the steps to lead you to think more in-depth about your software product analytics strategy. They will help you outline what you hope to achieve and how you will measure that achievement.
1. What are your key business capabilities?
The goal of this question is to extract the true business reasons that are leading to change. We all love software, but we know that the main reason to upgrade/replace software is not just for the fun of it. We need to extract the key business capabilities impacted by this change to then be able to measure against them.
To get you thinking about this question, here are some of the business capabilities that Silverline’s financial services team commonly hears from our banking and lending clients:
- Member 360: View of member household, single view of all member accounts, single view of all customer interactions and cases.
- Omnichannel member communication: Single backend accessible by online, mobile, and in a branch; online and branch experiences are in sync.
- Deposit growth: Fully automated consumer DAO process, modern UX/UI with analytics for onboarding.
2. What are a few meaningful key performance indicators (KPIs) or objectives and key results (OKRs) to support your business capabilities?
The next step is to assign relevant KPIs or OKRs to your business capabilities. Our Silverline mantra is that “success is measured according to how many times your users perform a key behavior.”
Our suggestion is to identify just one guiding metric, we call it the North Star metric. This single metric is measuring the vision behind the project. It is then important to support that North Star metric with a few other KPIs. These metrics must represent the details behind the change in your North Star. This way, you can effectively understand the impact of your technology, and understand the underlying functionality. For example, if your organization is implementing nCino for loan origination, your North Star metric might be to increase organic loan growth, and your supporting KPIs may be the time to close a loan or number of referrals.
3. What is your baseline?
Next, identify the current state of where you are at today with your software product to find a baseline to work from. Start by evaluating your current metrics and KPIs if you have them. Our goal here is to understand the impact of the new features/software, so we must take a snapshot of KPIs before we begin. If you are not currently measuring KPIs today, Silverline can work with you to do a manual baseline that captures the current state. Also, look at your company objectives and outcomes that may be affected by business processes. These may not be specific KPIs, but still helpful to understand impact.
If you are a bank or lender, these are some suggested company-wide value measures to review as you establish your baseline:
- Customer satisfaction score (CSAT)
- Net promoter score (NPS)
- Efficiency ratio
- Profitability
- Loan growth
- Deposit growth
- Organic growth
4. What analytics goals are you setting?
Now that you have your KPIs baselined, the next step is to set the analytics goals for your project. To build meaningful goals, look at industry reports, research, and white papers to discover industry standards and benchmarks. For example, if you have a bank call center and your goal is to decrease the call deflection rate, you can review industry reports to see the average rates and where you place in comparison. Silverline staff has access to benchmarking figures as well as industry experience to help you understand your current state.
Your goals can also relate to important industry trends. For example, if you find an upward swing with millennials preferring mobile banking, your goal could be to increase digital account openings by building a better digital experience.
These goals are important in driving the direction of your roadmap and feature backlog. We would also suggest tagging certain business capabilities to your features, so you can better predict expected outcomes as you add additional features to your Salesforce ecosystem.
5. Have you identified how you will measure and build reporting along with a report review strategy?
After your software product has launched, you must set up a strategy to ensure that you are achieving what you set out to achieve. Whether it’s in Salesforce, Tableau, CRM Analytics, or another measurement tool, all your KPI analytics should be automated and follow these strategies:
- The initial deployment of the solution should focus on adoption, bugs, and user feedback to ensure there are no issues or poor experiences. During the pilot, aim to make this happen at least weekly.
- Once you have general availability to all users, you can begin tracking progress with standard Salesforce reporting. Ensure business processes are being followed, and value metrics are beginning to show.
- Ongoing KPI analysis should happen by being split into detailed operational management KPIs (deal cycles, tasks, leads, opportunities, etc.) that are reviewed bi-weekly and high-level executive KPIs that are reviewed monthly. It’s important that leadership continues to see value, or inefficiencies in a simple way.
Lastly, keeping your product analytics focused is one of the difficult challenges when approaching product analytics. For this reason, financial institutions struggle with too many metrics and dashboards, making it very difficult to agree on what is truly adding value. Focusing your metrics will bring your leadership together and add clarity to the goals of your software.
Make the strategic shift to product analytics with Silverline
Silverline can help across your product development lifecycle from ideation and design to building and marketing, and ultimately realize the potential for your product analytics. Our extensive expertise with the Salesforce platform uniquely positions us to implement the right product analytics tools to drive business value. Learn more about how we can help your organization.