Wealth and asset management organizations are increasingly leaning into data and analytics to drive stronger business results. But this data is often siloed across disparate sources and lacks the holistic view to allow teams to confidently uncover actionable insights and make data-informed decisions. That’s why wealth and asset management organizations are turning to Salesforce CRM Analytics to make more intelligent decisions based on insights and connect data wherever it lives.
A Salesforce customer survey of CRM Analytics users found a nearly 30% increase in user productivity, a 25% jump in close rates, and 28% faster delivery of business-driving reports and analytics. The survey reported significant reductions in the time required to analyze information and average case age.
So, is investing in CRM Analytics the right move for your organization? Read on to learn how this tool can empower your organization with analytics and predictions in Salesforce workflows so you can scale quickly and work intelligently.
CRM Analytics delivers actionable insights
CRM Analytics is a product that can be used in your Salesforce to build a complex dashboard using Salesforce and external data. The data does not have to live in your Salesforce instance, and external data sources can be connected to the CRMA with what are called “data sets.”
Wealth and asset management organizations can slice and dice the CRM Analytics data in many ways. You can report on a large volume of data and aggregate it in different ways, plus do complex calculations.
The significant advantage of CRM Analytics is that it allows you to present analytics in the context of your CRM, whether it is a homepage dashboard or embedded to the record pages. Embedding analytics components to the firm or contact pages is a typical use case. Then, you can act on that data directly in your CRM, such as opening the record.
Dive deeper into data with CRM Analytics dashboards
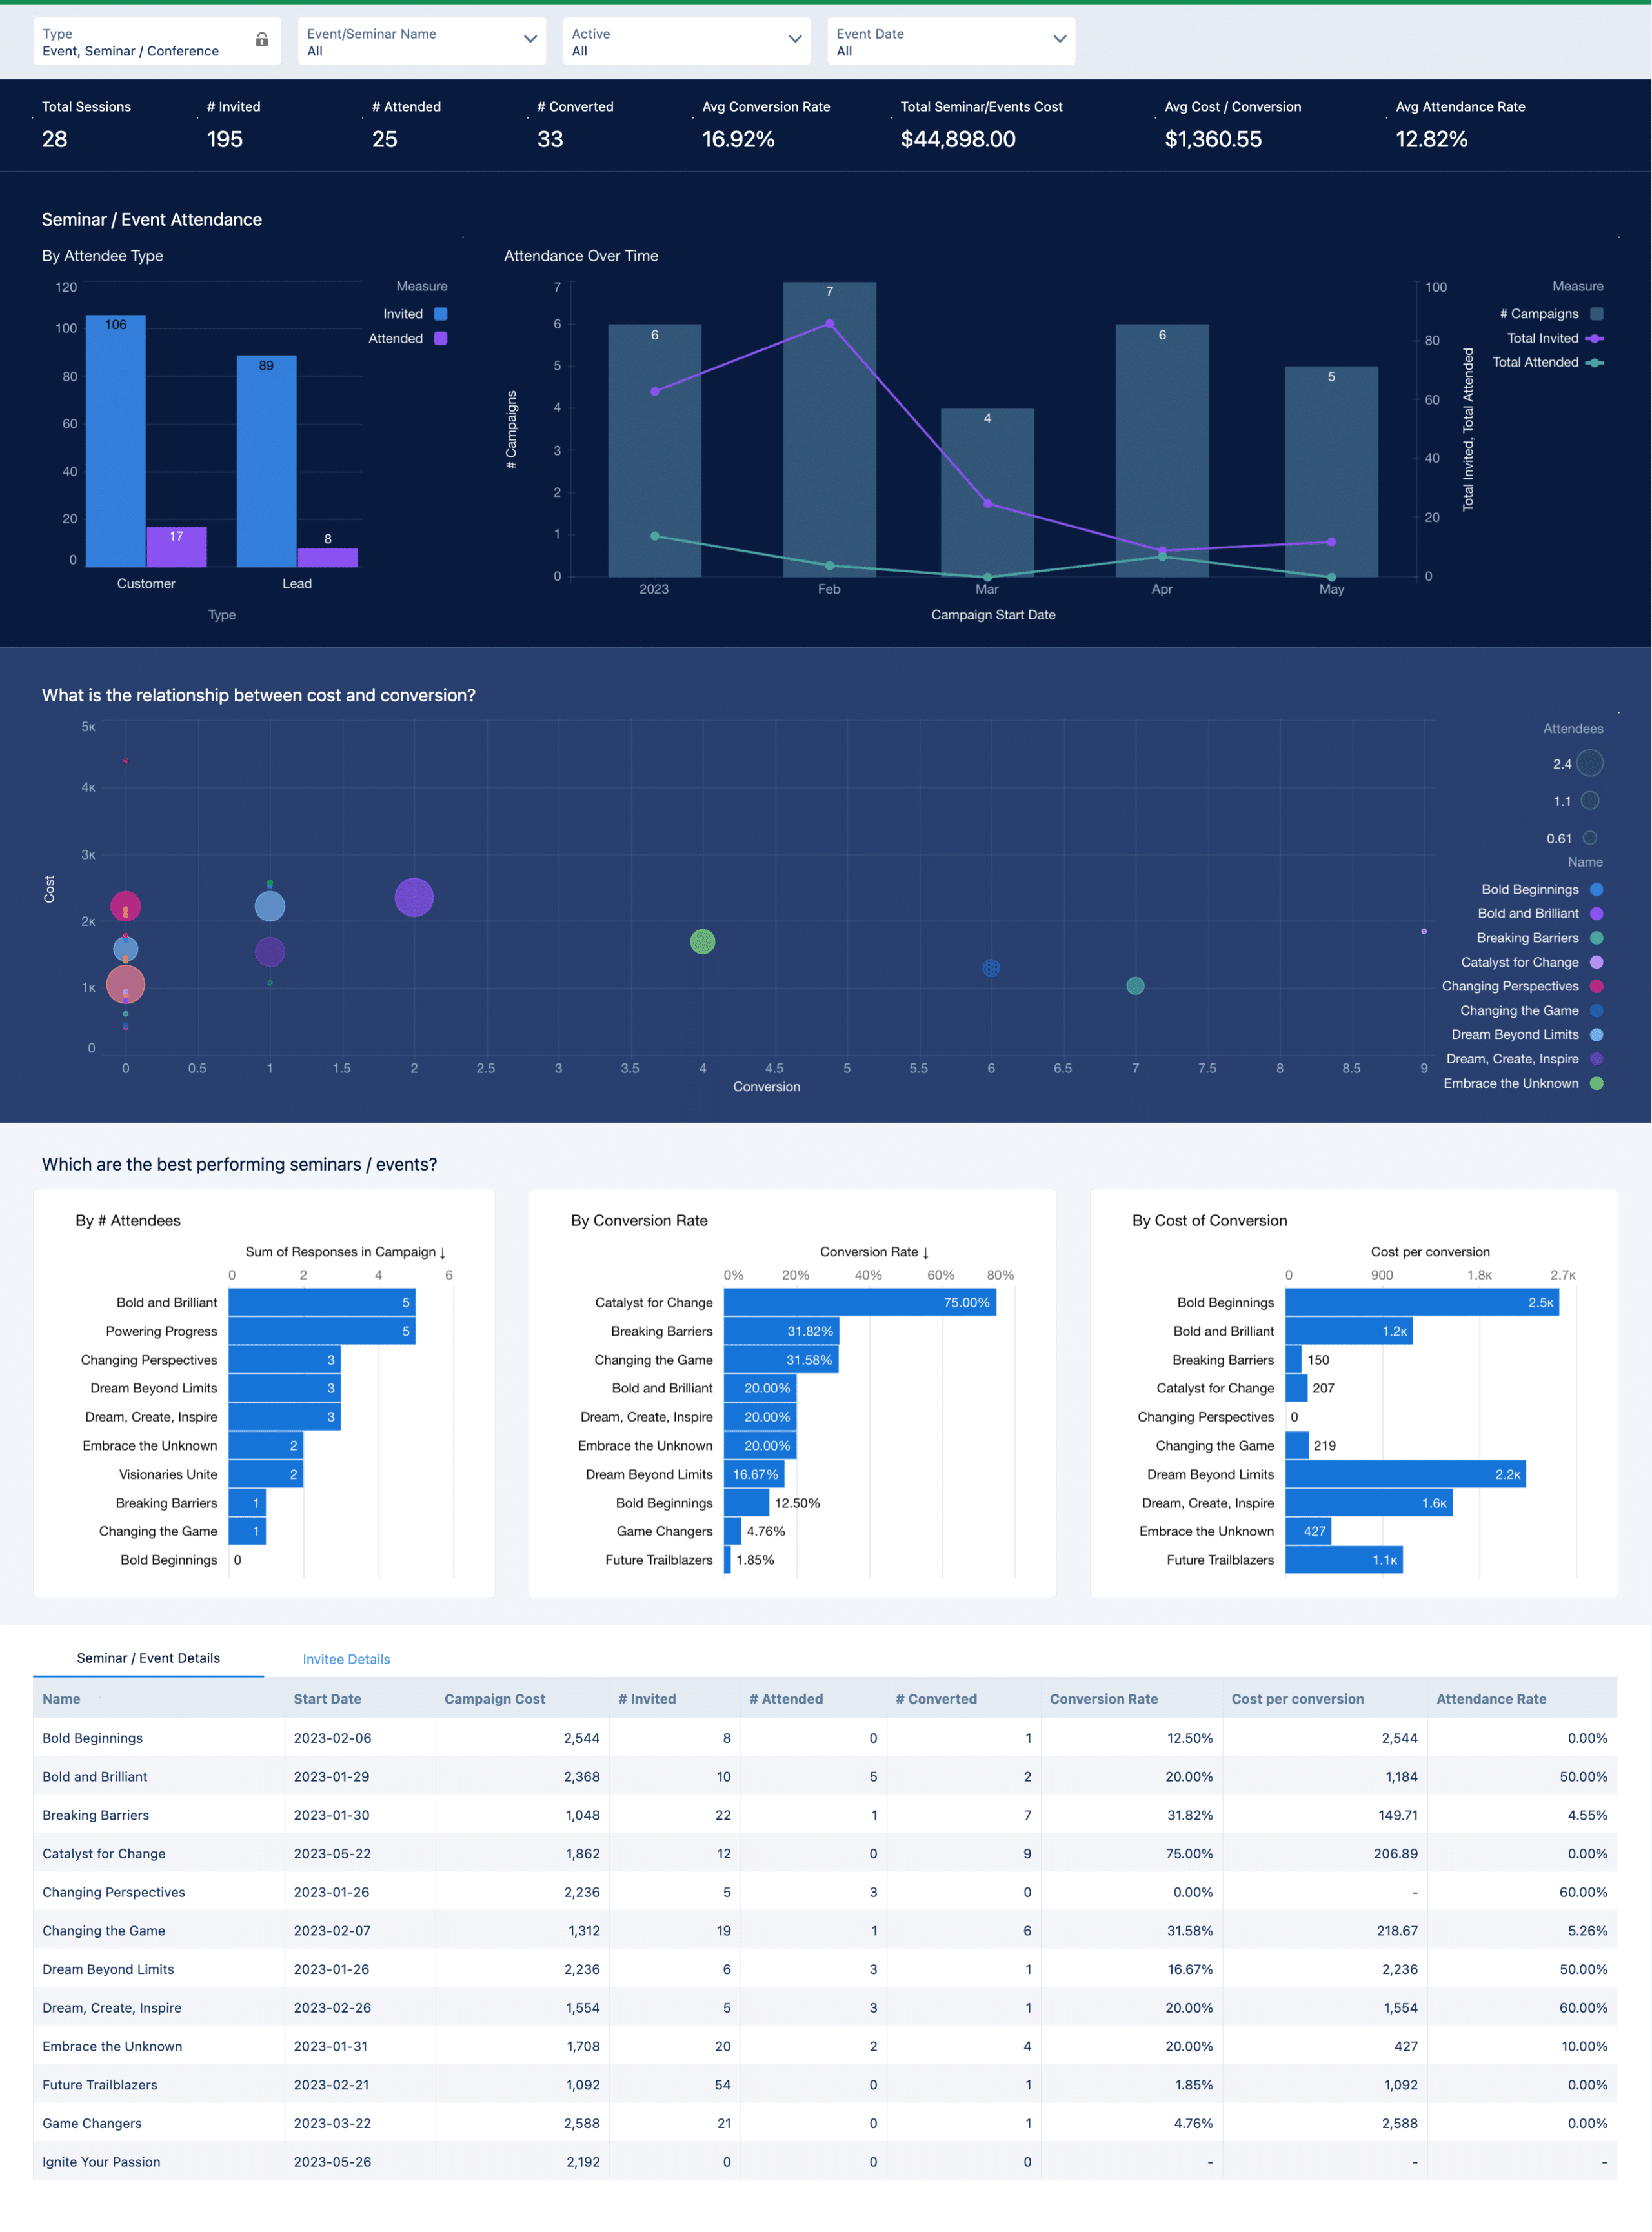
The CRM Analytics dashboard is an interactive collection of widgets that show query results from your data, whether that data comes from inside or outside Salesforce. Dashboards tell a multifaceted story using data visualizations and comparisons with charts showing an interactive picture of a filtered database query. You can navigate to different dashboards, use filters to narrow down the data displayed in charts, and sort and drill down into data.
Some of the key elements of a CRM Analytics dashboard include:
- Selection-based filters: A selection-based filter lets you apply whatever filters you wish while viewing the dashboard. Some of the different types of selection-based filter widgets are date, list, range, toggle, and charts.
- Charts: A rich variety of charts shows you data from multiple angles. Many parts of a chart are interactive so if you make a revision, it changes the other values in a chart, values in other charts, and number displays.
- Tables: A table provides the record-level details. You can sort tables to show the top and bottom records or create calculated columns in tables to compute values based on existing data.

Relevant CRM Analytics use cases for wealth and asset management organizations
Let’s look at some use cases for how CRM Analytics can bring value to wealth and asset management organizations. For example, say we have a company with an annuities line of business that wants to use a CRM Analytics dashboard. The company could use the dashboard to report on the high volume of transactional annuity data it has from an external system. CRM Analytics integrates, aggregates, and summarizes this data in a meaningful way and then enables users to explore the trends.
The dashboard allows a company to see sales by channels, products, firms, and also by data that is only captured in CRM, like firm strategy or parent firms. Users can see filters on the top that allow them to slice and dice this data the way they want to, and then action on that data in CRM.
With CRM Analytics, you can create a homepage / executive or summary dashboards, or embed your analytics to specific pages to make it more contextual to a specific firm or contact. For example, a dashboard that is embedded to a firm page can show different stats for that firm, such as sales, opportunities, or activities trends. When a user is on a firm or contact page, they can have this summary of important metrics for that firm or contact.
Organizations can create trend reports for the executive audience so they can see how the business is performing MoM and YoY grouped by different categories, such as by brokers, sales users, firms, or product. Users can then apply filters to see how firms perform for a specific product.
The campaign filter can be used for data that is created and managed in Salesforce but is not directly connected to sales. Users can filter to a specific campaign and see how the sales for contacts that were added to that campaign changed over time.


