
Dreamforce 2019 Recap from an Integration Trailblazer
Reading time: 3 minutes
I attended Dreamforce this year with a focus on Integration sessions and MuleSoft-related announcements. As usual, Dreamforce did not disappoint. Accelerators for Service Cloud and Commerce Cloud At the Integration Keynote, I witnessed a few awesome announcements. MuleSoft has announced accelerators for Service and Commerce clouds. These accelerators are a set of integration templates, API...
NYC MuleSoft Meetup Recap: Fostering Innovation through APIs
Reading time: 3 minutes
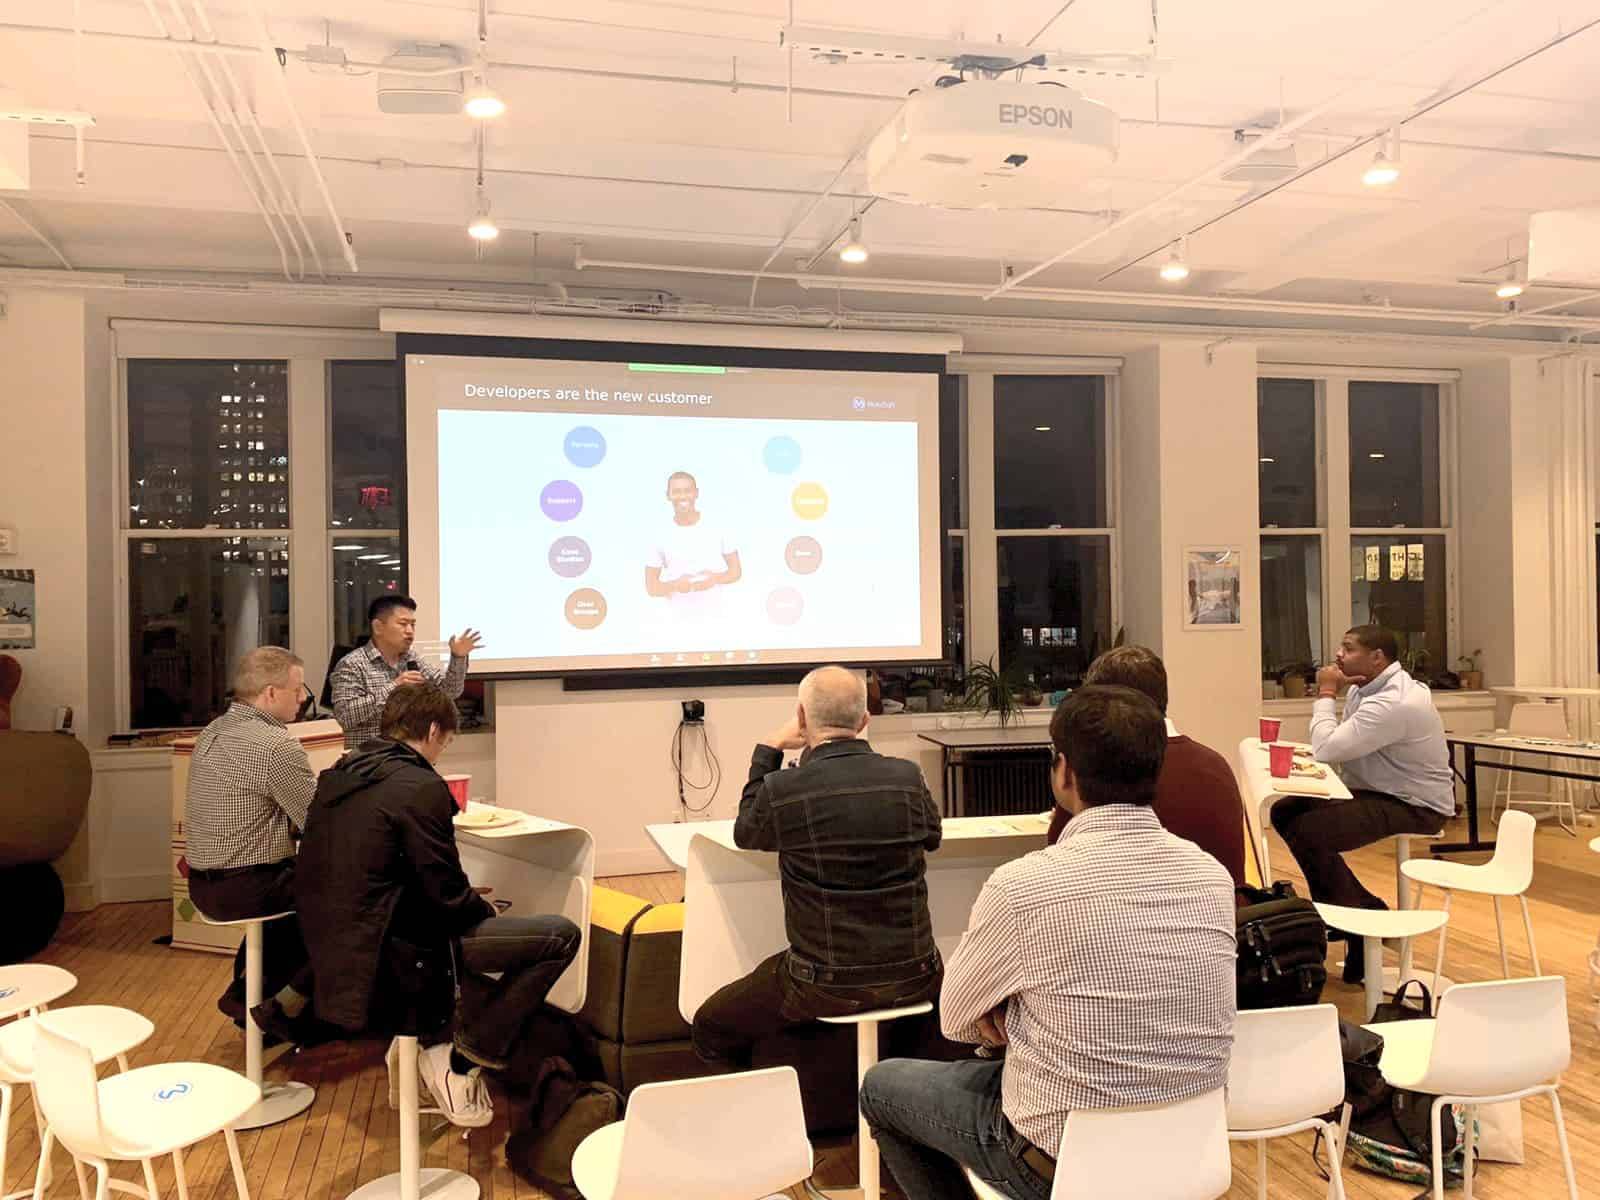
On Thursday, October 17th, 2019, Silverline hosted the quarterly NYC MuleSoft Meetup at our headquarters. The night kicked off with two presentations and ended with some networking and noshes. First, I led a discussion on Fostering Innovation through APIs. After going through the usual intros and logistical information about the Meetup, I polled the audience...

Mini Hackathon: How to Better Serve Customers through Integrated Data
Reading time: 7 minutes
In times of struggle, I’ve always been of the mind to try and help those in need. And in today’s world, my first thought is to look toward technology and the ways it can assist users in simplifying tasks, or making sense of information. To see what we could create around healthcare datasets, a few...

8 Signs You Need a New Data and Integration Strategy
Reading time: 4 minutes
A data and integration project is only as successful as the strategy put into place before the project kick-off. Here are 8 signs you may need a new data and integration strategy for your current or future projects.

Data Technology and Strategy: Key Ingredients for Robust Solutions
Reading time: 3 minutes
Business users often misclassify integration and data requirements as a supporting mechanism for broader digital transformation goals. Businesses with the drive to innovate should understand these initiatives are more than just a supporting mechanism: they are a competitive advantage and can be a differentiator in their industry. Trailblazing organizations are coming to understand that a...
Asset Management Pipeline Explorer
Reading time: 2 minutes
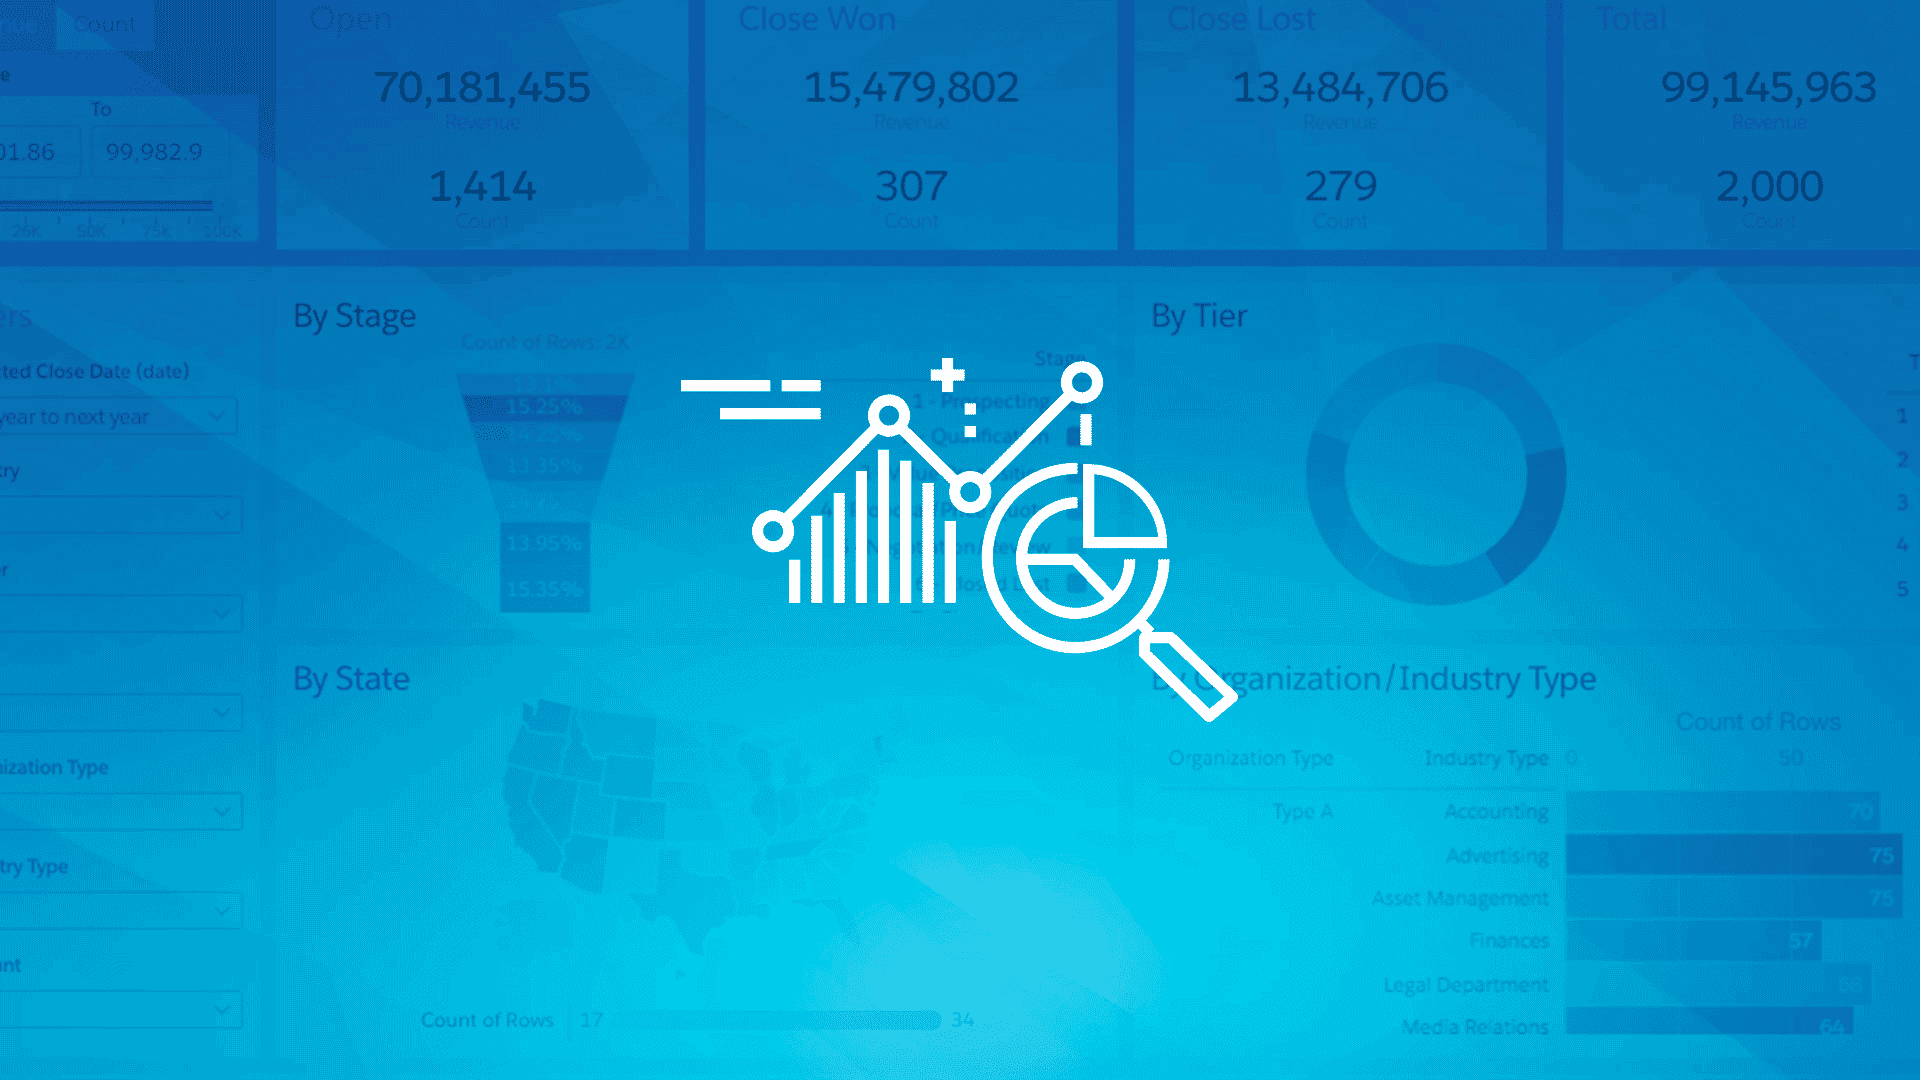
Are you an Asset Manager who wants more from your CRM? Are you having trouble getting a clear picture of everything going on with potential business? Seeking and obtaining new business from new clients has its challenges. There is an added challenge when it comes to existing clients. Understanding what is going on with business...
Better Patient Case Analysis
Reading time: < 1 minute
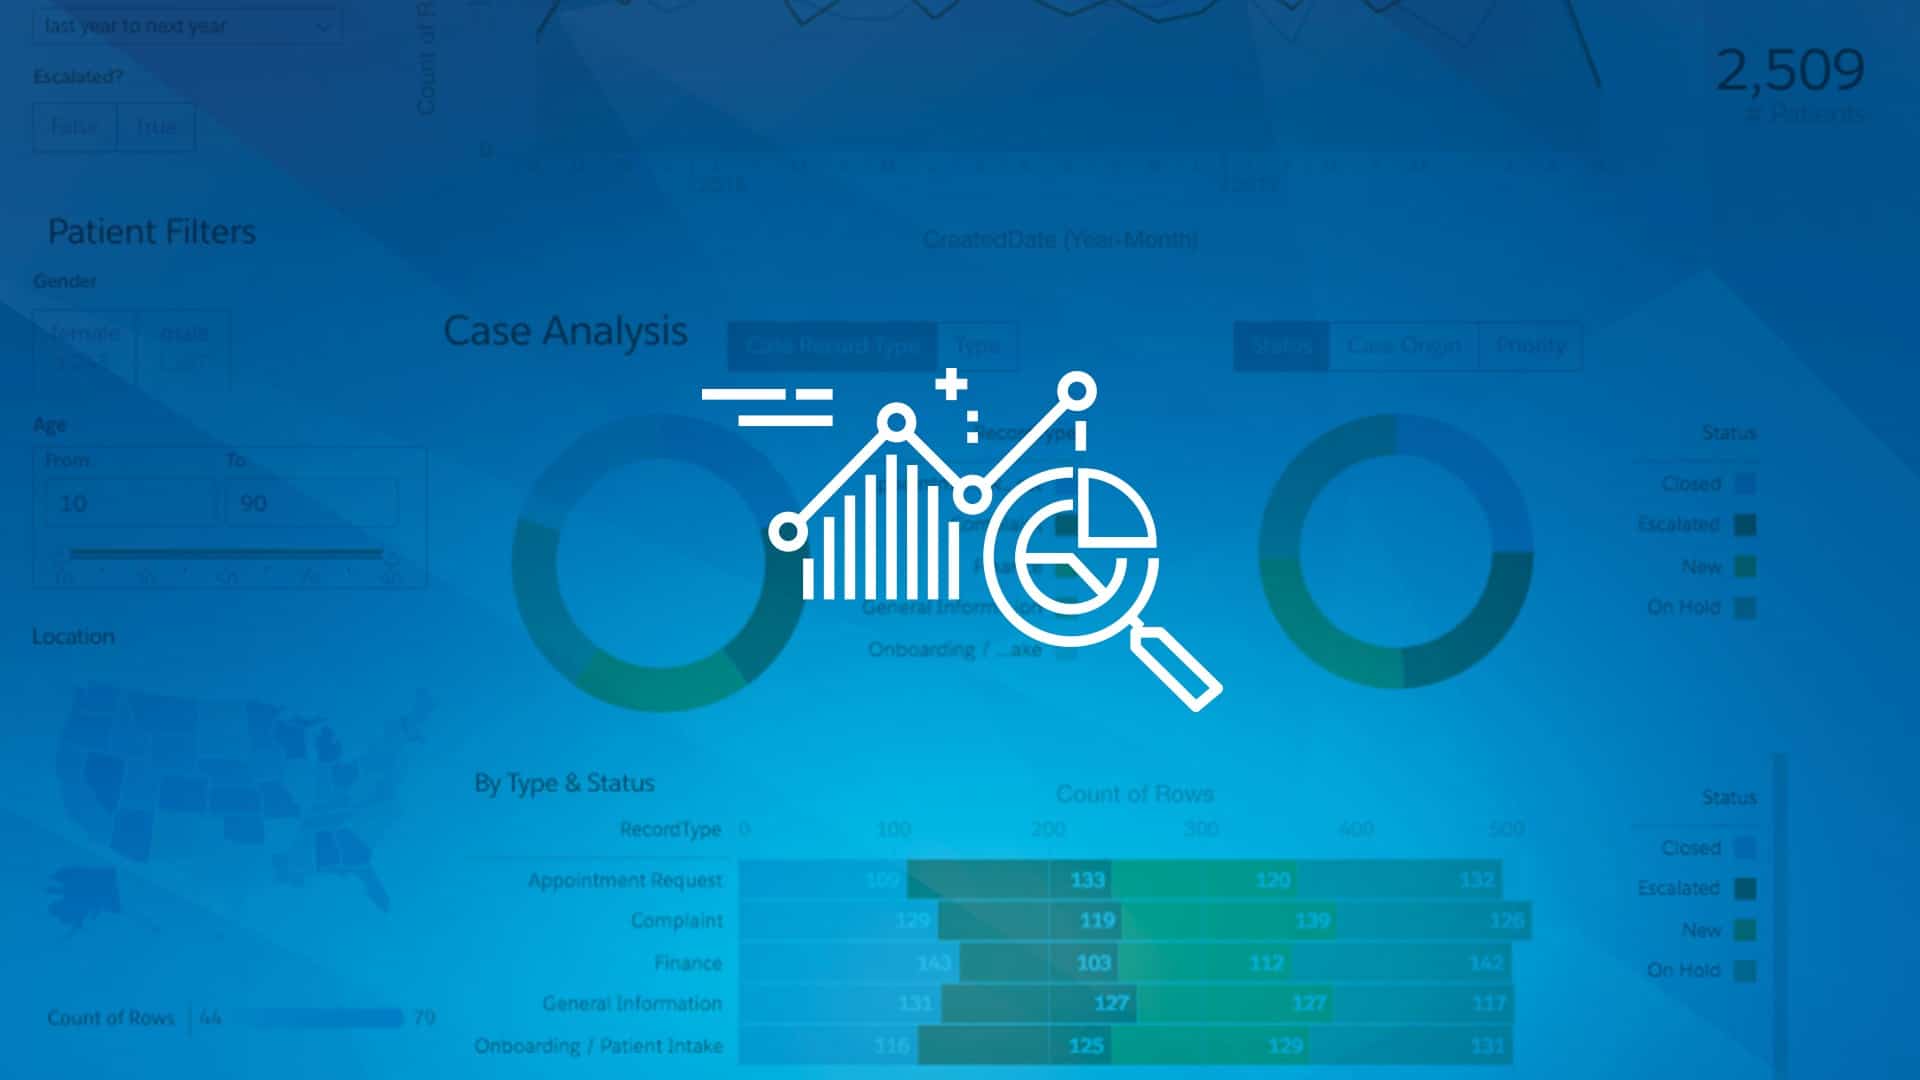
Are you a healthcare provider, facility admin or run a healthcare call center? Do you feel overwhelmed by the tremendous amount of patient and case data? Having a grasp on how many patients you provide care for at a given time can be a challenge. Budgeting for more providers, more supplies, and more resources is...
Fast Track Your Wave Dashboard Development
Reading time: < 1 minute
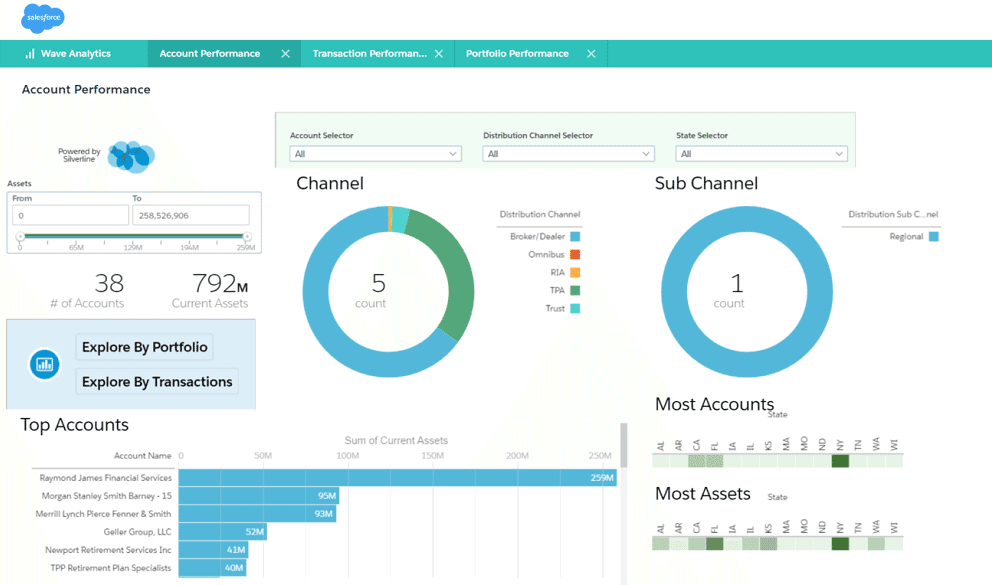
When you are building dashboards in any BI or Analytics tool, the design of the dashboard is usually a challenge that has to be solved each and every time. While each dashboard’s needs are different, I thought it would be great to always start off with a design that can help with telling the story of...

19 Reasons Why Asset Managers will love Wave Analytics
Reading time: 2 minutes
If you have an Asset Management Salesforce solution, wouldn’t you love to be able to track financial adviser performance? Monitor and see trends in sales flows? Slice and dice your AUM? Have a better way to help identify and service intermediaries? With Salesforce Wave Analytics, you can get all of that plus more. Here’s how:...
Salesforce Wave Analytics for Education – Review Classroom Performance
Reading time: 2 minutes
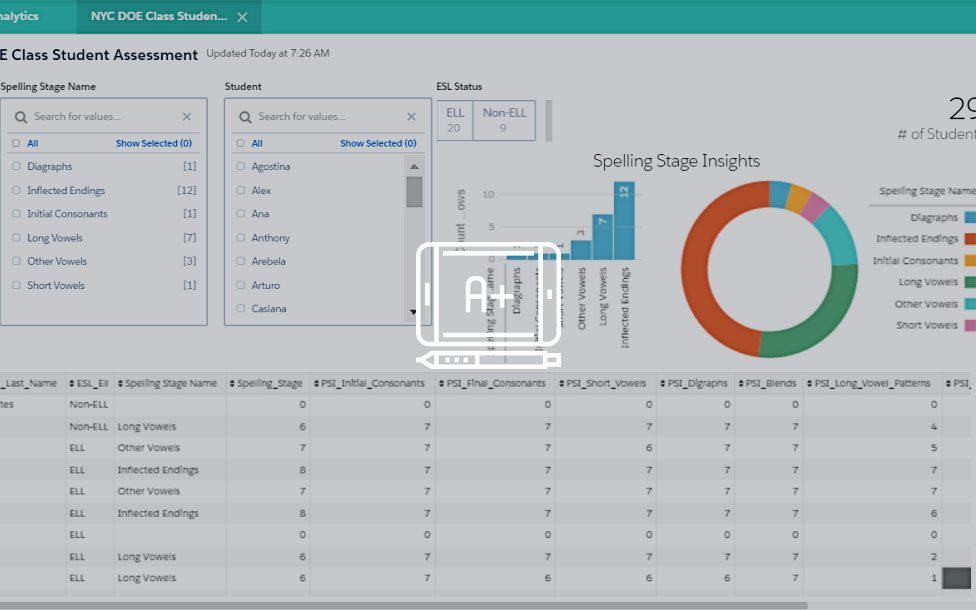
New York City has the largest school system in the United States, with over 1.1 million students enrolled. Teachers collect tons of data every single day (reading levels, math performance, language acquisition, attendance, parent communication, who receives free breakfast and where students go after school are just a few). New York City and its teachers...
- 1
- 2
